Immune monitoring by torque-teno virus load in addition to virus-specific T cells after pediatric kidney transplantation
David Nehl1, Xiaofei Liu3, Sebastian Voigt2, Raphael Schild6, Jun Oh6, Christina Taylan5, Lutz T Weber5, Nele Kanzelmeyer4, Anika Großhennig3, Lars Pape1, Thurid Ahlenstiel-Grunow1.
1Pediatric Nephrology, University Hospital of Essen, Essen, Germany; 2Virology, University Hospital of Essen, Essen, Germany; 3Biostatistics, MHH, Hannover, Germany; 4Pediatric Nephrology, MHH, Hannover, Germany; 5Pediatric Nephrology, University Hospital of Cologne, Cologne, Germany; 6Pediatric Nephrology, UKE, Hamburg, Germany
Introduction: Pharmacokinetic monitoring alone is insufficient to estimate the intensity of immunosuppression after kidney transplantation (Tx). The multicenter, randomized controlled IVIST trial demonstrated that additional steering of immunosuppressive therapy by virus-specific T cells (Tvis) is safe and reduces exposure to immunosuppressants after pediatric kidney Tx. Another promising biomarker is the torque teno virus (TTV) load which was associated with the risk of rejection and infection in some observational studies. We have now evaluated the potential benefit of additional analysis of TTV load to improve immune monitoring in the IVIST cohort.
Methods: In the randomized controlled IVIST trial, 31 pediatric kidney recipients were randomized to the intervention group with additional steering by Tvis levels. The immunosuppressive regimen consisted of basiliximab, cyclosporine A (CsA), everolimus (Eve) and prednisolone. In 27/31 patients of the intervention group (11.7±3.3 years), a retrospective analysis of TTV DNA was performed by PCR in frozen plasma samples collected prospectively at 20 visits (1-24 months (mo) after Tx). Post-transplant changes of TTV DNA and adenovirus-specific CD4 T cells (ADV-Tvis) over time have been evaluated by paired t-test, the correlations with immunosuppressants (mean daily dose and trough levels) by Spearman correlation coefficients.
Results: The mean TTV DNA of all plasma samples (n=474) was 4.4 ± 1.3 log10 copies/mL (1.4 log10 to 9.4 log10) and showed a significant association with follow-up time after Tx (p<0.0001): Under intensified immunosuppression in the initial post-transplant period, TTV DNA increased with a peak at 3 mo after Tx (5.5±1.4 log10); after reduction of immunosuppression, TTV load decreased significantly over time (6 mo post Tx: 4.3±1.1 log10, p=0.0002; 18 mo post Tx: 3.9±1.2 log10, p<0.0001). In contrast, mean ADV-Tvis levels showed a minimum at 2 mo after Tx and increased over time: from 1.47 cells/µL (2 mo post Tx) to 1.98 (6 mo post Tx, p=0.056) and 2.36 (22 mo post Tx, p=0.008) (Figure 1). TTV DNA showed weak correlations with mean daily dose of CsA, Eve and prednisolone and with trough levels of CsA and Eve (mean correlations from mo 3 to 24 post Tx: r=0.21-0.31; p≤0.0003).
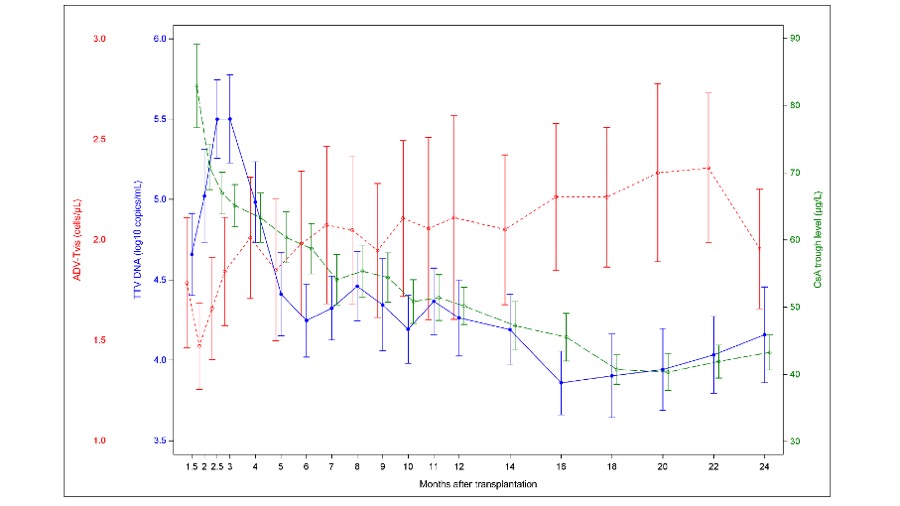
Conclusion: In this first combined analysis, TTV DNA presented an opposite course compared to ADV-Tvis in the first two years after Tx. Both biomarkers were associated with the post-transplant follow-up time and thereby with intensity of immunosuppression but with high inter-individual variations and weak correlations to dose and trough levels of immunosuppressants. Compared to ADV-Tvis, the mean TTV DNA only showed a delayed peak 3 mo after Tx, suggesting a delayed response of TTV to drug dose changes. Therefore, a combined post-transplant monitoring may have an additional value to identify over- and underimmunosuppression. Further randomized controlled trials are needed to confirm the benefit of a combined use of TTV and Tvis to optimize dosing of immunosuppressants.